The Butterfly Diagram
The Butterfly Diagram accentuates the continuous flow of materials in the circular economy. Its ambition is to showcase the difference between technical and organic cycles through their ‘value circles’. Popularized by the Ellen MacArthur Foundation, the butterfly diagram takes into consideration 3 driving principles, namely the effective use of finite resources, enhancing the utility of raw materials and minimizing waste generation.
What is the Butterfly Diagram?
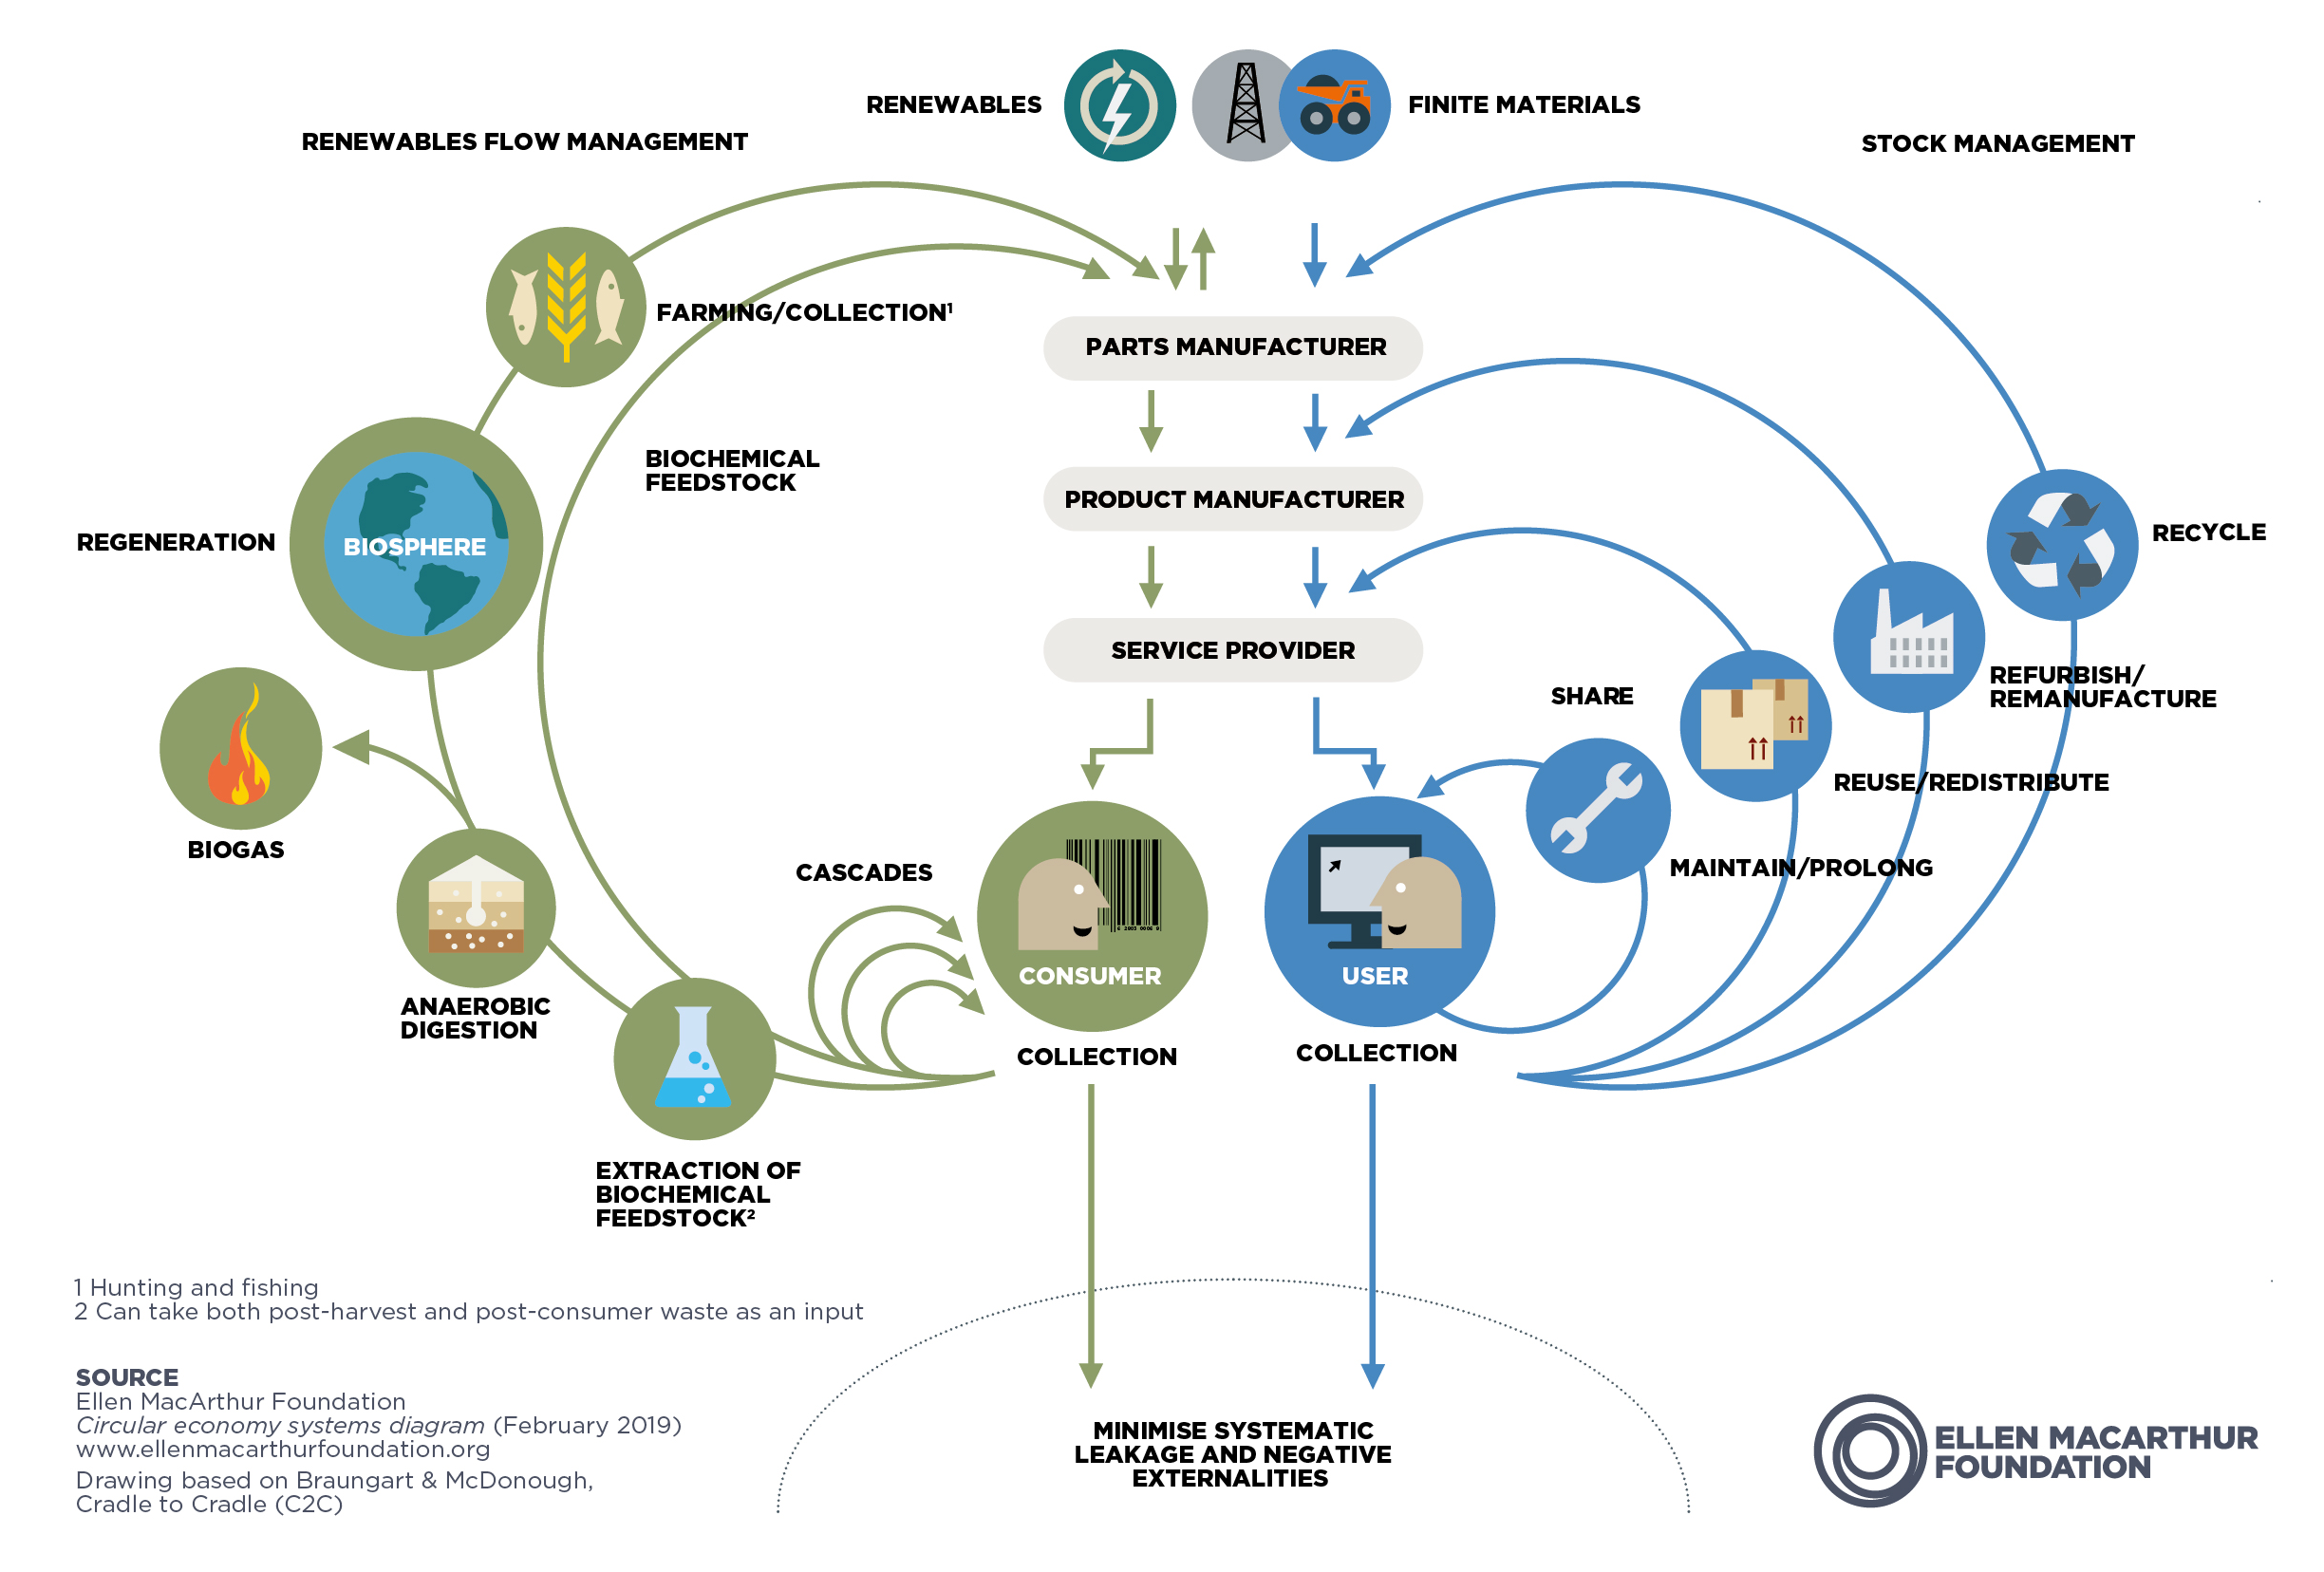
Simply put, the Butterfly Diagram explains the various flows of materials within the circular economy. Here’s how the Ellen MacArthur Foundation illustrates the Butterfly Diagram:

Source: The Ellen MacArthur Foundation
As authors Ed Weenk MSc PDEng and Rozanne Henzen mention in their book, ‘Mastering the Circular Economy’, the diagram illustrates a system of continuous cycles in a value chain. The cycles are distinguished in two segments. Each segment is centered around the materials used to make a product:
- The Biological Cycle (left side of the diagram) – focuses on materials which are biodegradable
- The Technical Cycle (right side of the diagram) – focuses on materials which are non-biodegradable.
The first step towards a circular economy is to segregate these two types of materials as they will require different reuse processes. The reusing phase creates loops for the resources on either side, creating a butterfly-like structure.
Technical Cycle: circular strategies and the R-Ladder
The technical cycle consists of products which are not biodegradable. However, that does not mean that they should lose their value after use. In fact, this is where the technical aspect of product manufacturing comes into play. At its inception, the product must be put together with raw materials that can be reused, like valuable metals and polymers. This cycle requires a proper management of finite material stocks, so that after restoring the product, its components, and the materials can flow back into the cycle.
This cycle consists of products that are maintained so that they retain their value for the longest time. It compels companies to make maximum use of limited natural resources and keep them at the peak of their utility for the longest time. This way the need to produce new products is diminished and it also maximizes the value for consumers. To get this loop right, it is essential that product manufacturers focus on the design, maintenance, and repair of the product. By ensuring better design and maintenance, the product can be rescued from early wear and tear.
The same product can be maintained and reused. It can also have the potential of a new buyer to enhance their original value and hence, might require some refurbishments. This loop might also require some innovative strategies to keep the business running in a competitive environment against linear alternatives.
Biological Cycle: bio-inspired and bio-based loop strategies
Most products in the biological cycle are biodegradable, and they range from natural raw materials such as wood to edible waste, such as food. These materials are expected to enter the biosphere as compost or other organic nutrients. Their regenerative nature safely returns them to the biocycle as ‘food’ or other forms of life and are expected to generate little to no waste. In fact, the waste of one material can be reused by another.
Ed Weenk notes, “The nature of design for the biological cycle represents a level of efficiency close to the intrinsic perfectioning of the efficiency of nature’s closed-loop ecosystem, as opposed to the impact-minimizing technical cycle.”
 Now you know
Now you know that the butterfly diagram shows how the materials a product is made of can be assigned to either the organic or the technical cycle. The technical cycle consists of raw materials that are non-biodegradable. In this cycle maximum emphasis is put into how the product is manufactured so that the product, components, and raw materials can be reused. The biological cycle consists of products that are biodegradable. The waste streams can contribute to the refurbishing of newer products.
Sources
- The butterfly diagram: visualising the circular economy
https://ellenmacarthurfoundation.org/circular-economy-diagram - Mastering the Circular Economy
https://bookshelf.vitalsource.com/reader/books/9781398602762/epubcfi/6/2[%3Bvnd.vst.idref%3Dcover]!/4/2[cover]/2/2%4050:40 - For a true circular economy, we must redefine waste
https://www.weforum.org/agenda/2019/11/build-circular-economy-stop-recycling/
You might want to learn more about
Sustainability v/s Circularity
The terms circularity and sustainability are often used interchangeably and that is exactly where the confusion lies. While the two concepts are not entirely different from one another – in fact, they are somewhat related – circularity and sustainability define two distinctive concepts.
The Value Hill
As a product moves uphill from the manufacturing stage to the selling point, it consistently sees an increase in its value. Once it has been purchased by the end-consumer the product’s value is at its highest. However, when the product’s usability ceases it gradually moves downhill and its value begins to decrease at every step. This is the traditional lifespan of a product on the value hill. Its’ value is determined by its core benefits but only for a certain period of time. The Value Hill Business Model expands on this idea.
Dive into our
knowledge base
Alignment
Blended learning
Experiential learning
Learning
Supply chain
Sustainability
- Sustainability
- Carbon footprint
- Circular Economy
- Does Green Governance drive the ride to a sustainable future?
- Everything You Need To Know About Eco-Efficiency
- Greenwashing: Everything you need to know
- Is it possible to measure the Triple Bottom Line?
- Sustainability v/s Circularity
- The 3Ps Series: People
- The 3Ps Series: Planet
- The 3Ps Series: Prosperity
- The Butterfly Diagram
- The Value Hill
- What are the 3Ps of Sustainability?
- What do we know about the Triple Bottom Line?

